
Common Uses
Use Trainer Performance to:
- Compare trainer activity and utilization across trainers and clubs.
- See how many members each trainer is working with and how many sessions they complete.
- Monitor cancellations and average session duration.
- Compare completed PT training hours, class hours, and PT Intro hours.
- Compare trainer availability with hours actually worked.
- Evaluate PT Intro close rates and associated PT sales.
- Review the members associated with an individual trainer.
- Drill into a trainer's sessions, utilization, member mix, and recent performance.
Dashboard Views
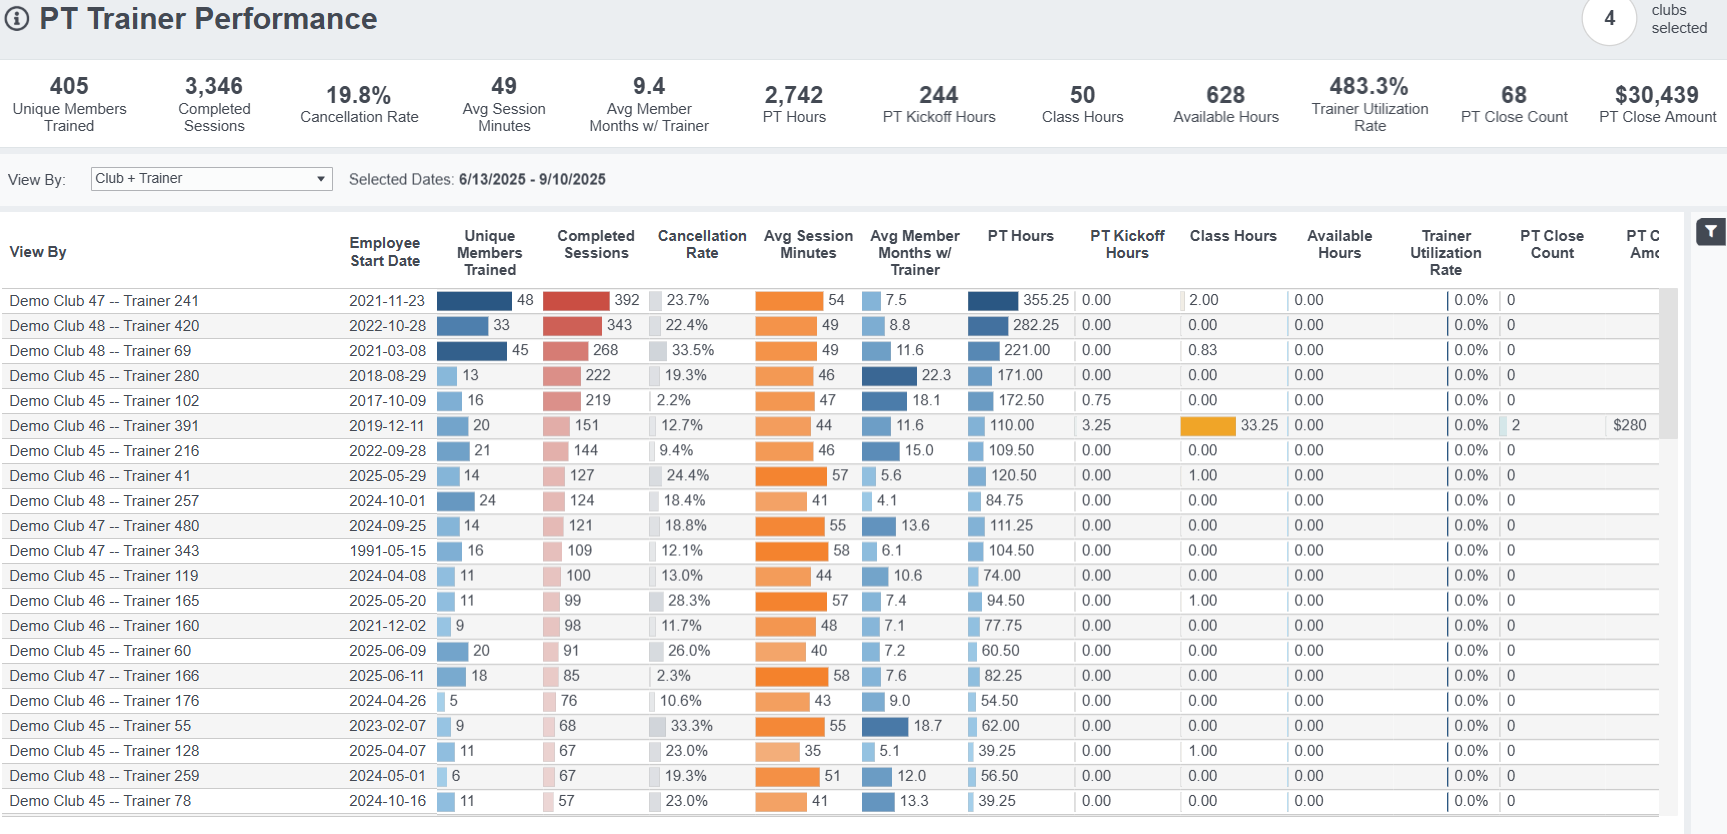
Trainer Performance
The main dashboard summarizes trainer performance for the selected reporting period and provides a detailed comparison across trainers.
Use View By to organize results by:
- Trainer
- Club + Trainer
- Club
- Trainer + Event Group
- Event Group
- Club + Event Group
- Club + Trainer + Event Group
Data Table
Use the Data Table for a detailed, table-based view of trainer performance. This is useful for comparing metrics side by side or exporting the underlying results for additional analysis.
Members
The Members view shows the members associated with trainer activity, including information such as member demographics and recent session activity.
Use this view to move from trainer-level metrics to the individual members behind those results.
Availability
The Availability view shows trainer availability by date where availability information is provided by the source system.
Choose from This Week, Next Week, This Month, or Next Month to review upcoming capacity and identify trainers with available time.
Drilldown
Use the Drilldown view for a deeper look at an individual trainer. The drilldown includes trainer profile information, utilization, training activity, PT Intro performance, day-and-time patterns, event groups, and member demographics.
It also provides recent-period comparisons to help identify changes in trainer activity and performance.
Related Dashboards
The Related Dashboards view provides quick access to other Personal Training analysis, including PT Usage, PT Usage Trends, PT Sales Revenue and Enrollment, PT Sales Trends, First PT Purchase Behavior, and Salesperson Performance.
Metric Definitions
Trainer Activity Metrics
- Unique Members Trained: Number of distinct members with completed Personal Training sessions during the selected period.
- Completed Sessions: Number of distinct PT sessions marked Completed.
- Total Sessions: PT sessions that are not cancelled, including completed and pending sessions.
- Pending Sessions: PT sessions that have not yet been marked Completed or Cancelled.
- Cancelled Sessions: PT sessions marked with a cancelled status.
- Cancellation Rate: Cancelled sessions divided by completed and cancelled sessions. Pending sessions are excluded.
- Avg Session Duration: Average duration, in minutes, of completed PT sessions.
- Avg Sessions per Member: Average number of completed sessions per unique member trained.
- Avg Members per Session: Average number of members participating in each completed training session.
- Avg Member Duration with Trainer: Average length of the trainer-member relationship, in months, for members with completed training activity.
Trainer Hours and Utilization
- Training Hours: Total hours from completed Personal Training sessions.
- Class Hours: Total hours spent instructing completed classes.
- PT Intro Hours: Total hours spent conducting completed PT Kickoff/Intro sessions.
- Available Hours: Total trainer availability provided by the source system for the selected period.
- Trainer Utilization Rate: Completed Training Hours plus Class Hours divided by Available Hours. PT Kickoff/Intro hours are not included in this utilization calculation.
Availability and utilization metrics require trainer availability data from the source system.
PT Intro and Close Metrics
- PT Intro Show Count: Number of PT Intro/Kickoff sessions completed by the trainer during the selected period.
- PT Close Count: Number of completed PT Intros associated with the trainer that were followed by a qualifying personal training purchase within 30 days of the PT Intro date. The purchase must occur on or after the completed PT Intro. If multiple qualifying purchases occur during the 30-day window, the first qualifying purchase is associated with the PT Intro.
- PT Close %: Percentage of completed PT Intro appointments that resulted in a qualifying PT purchase within 30 days. Calculated as Close Count ÷ Show Count.
- PT Close Amount: Personal training purchase amount associated with the Close. For a PIF package, this is the qualifying PIF purchase amount; for a recurring package, this is the qualifying recurring/EFT amount.
Trainer Performance evaluates PT Intro activity from the trainer's perspective. The trainer shown here is the trainer who completed the PT Intro or is associated with the PT close and may not be the salesperson who originally sold the membership.
Classes and Event Groups
Personal Training sessions and classes are identified through the Event Groups configured for your account.
- Event Group: The Easalytics grouping used to identify and categorize events such as Personal Training, PT Intros/Kickoffs, and classes.
- Classes: Number of classes instructed by the trainer.
- Class Hours: Total duration of completed classes instructed by the trainer.
Your results depend on your organization's Event Group configuration and the event information available from your source system.
Date and Reporting Controls
Use Quick Dates to select common reporting periods such as Month to Date (MTD), Quarter to Date (QTD), Year to Date (YTD), Last Month, rolling-day periods, or a Custom Range.
Use View By to change the level at which trainers, clubs, and Event Groups are compared.
Understanding Trainer vs. Salesperson Reporting
Trainer Performance evaluates what happens after members enter the Personal Training process: training sessions, PT Intro activity, trainer capacity, utilization, and PT closes.
Salesperson Performance evaluates new membership sales and the PT Intro handoff from the perspective of the membership salesperson.
Because the dashboards answer different questions, a salesperson associated with a new member is not necessarily the same employee as the trainer associated with that member's PT Intro or Personal Training activity.
Metric & Attribute Definitions
- Unique Members Trained: the count of unique members taking PT sessions, regardless of how many sessions they took
- Total Sessions: the number of PT Events in Completed or Pending status, excluding Cancelled sessions.
- Completed Sessions: the number of PT Events, which are configured as Personal Training in Easalytics Event Group Admin, that are marked as completed in the time period.
- Pending Sessions: the number of PT Events that are not marked Complete or Cancelled
- Cancelled Sessions: the number of PT Events that are marked as Cancelled
- Cancellation Rate: The number of cancelled sessions divided by the sum of Completed sessions and Cancelled sessions. Excludes pending sessions.
- Session Duration, Total Session Duration, Average Session Duration: The length of a Personal Training session, usually expressed in minutes. Often times this metric is averaged or summed across PT sessions.
- Average Sessions per Member: the average number of sessions taken for each unique member trained
- Average Members per Session: the average number of members in each training session
- Event Name: these are the Personal Training Events which are configured as Personal Training in Easalytics Event Group Admin.
- PT Intro Show Count: Number of PT Intro sessions associated with the trainer that were marked Completed during the selected period. PT Intro events are identified through Event Grouping as events with an Event Group Type of PT Intro.
- PT Intro Hours: Total time associated with the completed PT Intro sessions included in PT Intro Show Count.
- Classes: the number of classes completed by the Trainer alongside their training and PT Kickoff time
- Class Duration: the amount of hours of classes instructed by the Trainer
- Close Count: Number of completed PT Intros followed by a qualifying personal training purchase within 30 days of the PT Intro date. The purchase must occur on or after the completed PT Intro. If multiple qualifying purchases occur during the 30-day window, the first qualifying purchase is associated with the PT Intro.
- Close %: Percentage of completed PT Intro appointments that resulted in a qualifying PT purchase within 30 days. Calculated as Close Count ÷ Show Count.
- Close Amount: Personal training purchase amount associated with the Close. For a PIF package, this is the qualifying PIF purchase amount; for a recurring package, this is the qualifying recurring/EFT amount.
A PT Intro Show and its related PT Close may occur on different dates. Show metrics are reported based on the PT Intro session date; Close metrics are reported based on the qualifying PT purchase date.