
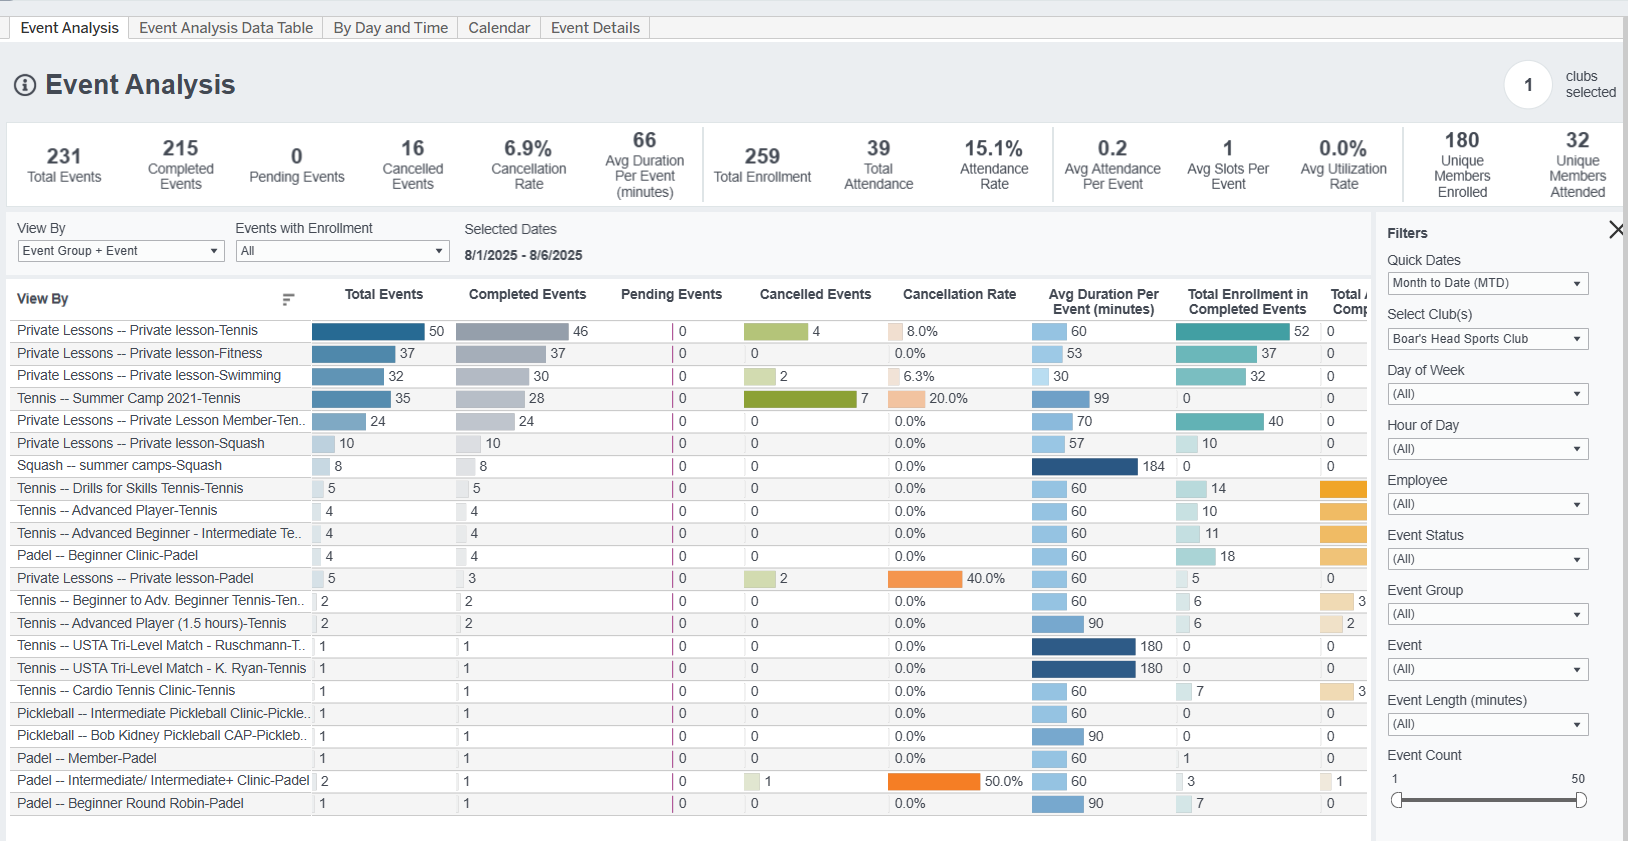
Use this dashboard to analyze event volume, enrollment, attendance, cancellations, utilization, and member participation across event group types, event groups, clubs, employees, days, times, locations, and resources.
This dashboard reflects event, enrollment, attendance, and capacity records submitted from your member management system. Available metrics and detail may vary depending on how your events are configured and how attendance, capacity, and event status are tracked in your source system.
To focus on the Event Group Type of Classes, you can also use the Class Attendance and Class Attendance Trends dashboards. And to focus on Personal Training events, use the PT Usage, PT Usage Trends and or the Trainer Performance dashboards.
Common Event Attendance Dashboard Uses
- Evaluate overall event performance across all scheduled programming
- Compare attendance, enrollment, cancellation, and utilization by event type or event group
- Identify which events, days, times, locations, and resources are most or least utilized
- Review member participation across all event types
- Analyze cancellation trends by group, employee, location, or time period
- Understand future demand for pending events and enrollments
- Review location and resource usage, such as rooms, courts, lanes, studios, or other bookable spaces
Dashboard Reporting Views
| View | Description |
|---|---|
| Event Analysis | Summary view for comparing event volume, enrollment, attendance, cancellation, and utilization by the selected “View By” option. Drill down into the specific Event Details or Event + Member Details. |
| Data Table | A table-based version of the dashboard data, useful for reviewing or exporting details. |
| By Day and Time | Shows event activity by day of week and hour of day. Use this to identify popular or underutilized schedule times. |
| Calendar | Displays scheduled events in a calendar-style view. Use this to review schedule mix, event timing, and activity across the selected date range. |
| Event Details | Event-level detail for reviewing individual scheduled events and their related metrics. Drill down to specific Event + Member details. |
| Event + Member Details | Member-level detail tied to specific events, including enrollment and attendance records where available. |
| Member Event Counts | Summary of event participation, showing the distribution of how many events members are attending in the reporting period, with the applied filters. Drill down to the specific members attending. |
| Member Details | Member-level detail of event participation, showing by member how many events are attended in the reporting period. Drill down to the specific events attended. |
| Location Detail Analysis | Compares event performance by location and resource. Use this to evaluate demand and utilization across physical spaces. |
| Location Detail By Day and Time | Shows location and resource activity by day and hour. Use this to identify high-demand or underutilized spaces by schedule time. |
| Event Location Details | Event-level location and resource detail, such as studios, courts, rooms, lanes, or other assigned spaces. |
Key Fields
-
Event Group Type
Highest-level event category used to organize event reporting. Easalytics event group types include Class, PT, PT Intro, and Other. These are assigned through the Event Grouping Admin section of Easalytics, and are used to describe the top-level bucket an event belongs, and for filtering and comparing broad event categories. -
Event Group
A reporting group that organizes similar events or services under a common category, such as Yoga, Tennis Lessons, Childcare, or Personal Training. It sits below Event Group Type and above specific Event names in the event hierarchy. Use to compare event programs without listing every individual event. Event Groups are managed in the Event Grouping Admin as well. -
Event
The specific event name or scheduled service/class name from the source system. Sits below Event Group in the hierarchy. Examples may include specific classes, lessons, clinics, or program names. -
Location
The scheduled place or area where the event occurs, such as a studio, court, room, pool, or other facility location. When the source system provides a combined location value, Easalytics may split it into Service, Location, and Resource fields for location-detail views. Use Location for the general place/area, not the specific asset. -
Resource
The specific bookable asset assigned to an event within a location, such as a court 1, room 2, lane 3, or other schedulable resource. An event may have one resource, multiple resources, or no resource depending on source-system setup. Location Detail views may show one row per resource when multiple resources are attached. Use Resource for the specific assigned asset within the location. - Employee
The staff member, instructor, trainer, or employee associated with the event, when available from the source system. - Event Status
The status of the event from the member management system, such as completed, cancelled, pending, or another configured status. - Event Length
The scheduled duration of the event in minutes. Use this to compare performance across shorter or longer event formats.
Event Metric Definitions
| Metric / Field | Definition |
| Total Events | Total number of scheduled event occurrences in the selected date range and filters. Each event occurrence is counted once, regardless of how many members enrolled or attended. Includes completed, cancelled, and pending/unfinalized events unless the dashboard filters exclude them. |
| Finalized Events | Number of event occurrences that have a finalized outcome in the source data, including Completed, Canceled-Charge, Canceled-No Charge. Used as the denominator for Cancellation Rate. |
| Completed Events | Number of event occurrences with a completed and non-cancelled final status. Counts event occurrences, not member attendance records. Use to separate events that happened from cancelled events. Used as the denominator for Attendance Rate, Slots Available, and Event Utilization. |
| Cancelled Events | Number of event occurrences with a cancelled final status. Counts cancelled event occurrences, not member cancellations or cancelled enrollments. Use to explain event-level cancellation volume. |
| Cancellation Rate | Percent of finalized events that were cancelled. Cancelled Events / Finalized Events. Uses finalized events as the denominator so pending/unfinalized events do not distort the rate. |
| Pending Events | Number of scheduled event occurrences that are not yet finalized. These are commonly future events or events that have not been closed out. Pending events are tracked separately from finalized-event attendance outcomes. Use for forward-looking scheduled event volume. |
| Pending Enrollments | Total member enrollments or reservations tied to pending events. May display N/A when there are no pending events in the selected filters or when pending enrollment data is not available for the current view. |
| Unique Members Enrolled in Pending Events | Distinct count of members enrolled in pending events. Each member is counted once within the selected filters, even if they are enrolled in multiple pending events. Use when explaining how many people are currently signed up for pending events. |
| Unique Members Enrolled in Finalized Events | Distinct count of members with at least one enrollment or reservation in finalized events, including Completed and Cancelled events. Each member is counted once within the selected filters and date range, even if they enrolled in multiple finalized events. Includes members who enrolled but did not attend. |
| Unique Members Attended | Distinct count of members who were marked as attended/present for finalized and completed events. Each member is counted once within the selected filters and date range, even if they attended multiple events. |
| Avg Events Attended Per Member | Average finalized-event participation per unique member attending within the selected filters and date range. It answers: on average, of members who attended, how many events did they attend? |
| Total Enrollment in Finalized Events | Total count of enrollment or reservation records for finalized events, including Completed & Canceled events. A member can contribute more than one enrollment if they enrolled in multiple finalized events. Use as the denominator for Attendance Rate. |
| Total Attendance | Total count of attended/present attendance records for finalized, completed events. A member can contribute more than one attendance if they attended multiple finalized events. Use as the numerator for Avg Attendance Per Event. |
| Registered Attendance | A component of Total Attendance, This is the count of attended/present attendance records for finalized events who were also marked as Enrolled. Use as the numerator for Attendance Rate. |
| Walk-in Attendance | A component of Total Attendance, this is the number of walk-in attendees marked in the source system. Not all systems capture walk-in counts, and walk-in counts are not associated to specific members and do not affect unique members enrolled or attended. |
| Attendance Rate | Percent of event enrollments that resulted in attendance for completed events. Registered Attendance / Total Enrollment in Completed Events. Use to explain attendance conversion from enrollment to attended for non-cancelled finalized events. |
| Avg Attendance Per Event | Average Total Attendance per Completed event. Use when comparing average event turnout across time periods, clubs, groups, or event types. |
| Avg Slots Per Event | Average available capacity per event for completed events, based on the number of slots configured for the events in scope. Total available slots / number of events with slot capacity in the selected filters for Completed events. Slot availability depends on source-system data. Use to explain average event size/capacity. |
| Avg Event Utilization | Average percent of available event capacity that was used for Completed / non-cancelled events. Total Attendance divided by Available Slots, usually calculated at the event level and then averaged. Use to explain how full events were relative to configured capacity. |
Attendance Rate vs. Event Utilization
Attendance Rate and Event Utilization measure different things.
Attendance Rate compares attendance to enrollment. For example, if 10 members enroll in an event and 9 attend, the attendance rate is 90%.
Event Utilization compares attendance to available capacity. For example, if an event has 20 available slots and 10 members attend, utilization is 50%.
An event can have a high attendance rate but low utilization. For example, if 5 members enroll, all 5 attend, and the event has 10 available slots, the attendance rate is 100%, but utilization is 50%.